Category: Public Posts (page 1 of 2)

Excerpt from Macrovoices Podcast with Dr Pippa Malmgren

03/02/19

First, if you don’t regularly listen to Erik Townsend and his MacroVoices podcast, you should.

Erik’s primary trading framework is futures and options on futures, so we can better relate to him and his market outlooks.

I’ve grabbed a small excerpt from his podcast with Dr. Pippa Malmgren (recorded on 2/28/19) where she gives a very unique take on China vs Trump, the South China Seas – and finally an extremely out-of the box hypothetical on President Trump regarding the 2020 election.

This excerpt is only about 10 minutes from an hour and half interview.   Listening to this brief clip is a must, but I encourage everyone to go to  https://www.macrovoices.com/  and listen to the entire interview.

MacroVoices_with_Dr_Pippa_Malmgren.mp3


[Replay] President’s Day Video

‘President’s Day Weekend’ Fun Video with a “Crazy” 100% Back-Test Using Our Combo Lasers

Over the President’s Day weekend we recorded a special video with a brief market overview along with ‘fun’ look at a system back-test using a combination that includes (2) of our ‘Laser Indications’ – plus – our new Cycle extreme indicator.

Nothing is 100% in trading.  (At least we’ve never discovered any.)   So, it’s important to be reminded of this before viewing the video.  Why?  Because, the ‘hypothetical’ results of the backtest (using the Short triggers only) came in at 100%.   Additionally, the back-test was for only the past 90 days.  Keep that in mind, too.

With that said, we think it’s a decent illustration of what could be possible using well-developed signals and indications.

Let’s face it.  For traders, it is novel and fun when you come across something that tests 100%.  So, we decided to use this example for the President’s Day video.

After watching the video, if you want to test drive a membership to our Full Subscription services…. LiveScreen showing all of our screens and ‘laser indications’, Audio Alerts, Members-Only SLACK channels, on-going market views and more –  CLICK HERE.

Hope you enjoy the video!

Video Link:
President’s Day: Market View & Review of “100%” System Test


Disclaimer and Terms of Use:

The past performance of any trading system or methodology is not necessarily indicative of future results
CFTC RULE 4.41 – HYPOTHETICAL OR SIMULATED PERFORMANCE RESULTS HAVE CERTAIN LIMITATIONS. UNLIKE AN ACTUAL PERFORMANCE RECORD, SIMULATED RESULTS DO NOT REPRESENT ACTUAL TRADING. ALSO, SINCE THE TRADES HAVE NOT BEEN EXECUTED, THE RESULTS MAY HAVE UNDER-OR-OVER COMPENSATED FOR THE IMPACT, IF ANY, OF CERTAIN MARKET FACTORS, SUCH AS LACK OF LIQUIDITY.

SIMULATED TRADING PROGRAMS IN GENERAL ARE ALSO SUBJECT TO THE FACT THAT THEY ARE DESIGNED WITH THE BENEFIT OF HINDSIGHT. NO REPRESENTATION IS BEING MADE THAT ANY ACCOUNT WILL OR IS LIKELY TO ACHIEVE PROFIT OR LOSSES SIMILAR TO THOSE SHOWN.

Futures and options trading involve substantial risk. The valuation of futures and options may fluctuate, and as a result, you may lose more than your original investment. In no event should the content of any BamaTrader email or website be construed as an express of an implied promise, guarantee or implication by or from BamaTrader, its owners or affiliates that you will profit or that losses can or will be limited in any manner whatsoever. Past performance is not necessarily indicative of future results. Information provided on any BamaTrader email or website is intended solely for informative purposes and is obtained from sources believed to be reliable. Information is in no way guaranteed. No guarantee of any kind is implied or possible where projections of future conditions are attempted. By receiving any communication from BamaTrader, you agree that any information provided is solely the opinion of BamaTrader and his affiliates and not considered to be investment advice of any kind. You agree to trade your own risk and seek your own professional advice before investing.
By accepting and opening this email you are agreeing to the terms of use and acknowledging the Full Disclaimer and Terms of use located at:  https://www.bamatrader.net/disclaimer-legal/

Weekly Market View August 2, 2018

Thursday
08/02/18
12:35pmCT
Unless you trade U.S. equity Futures, it’s hard to describe just how mixed and choppy internal Order Flows have been for the last 3 to 5 sessions.
Not quite believing the extent of Order Flow ‘chop’ myself – I took a deep(er) dive into internals during our post-market work after the close.
Seems like equity futures, and maybe the market itself, can’t quite break free from the “holiday trading spell” cast during the week of July 4th.
Fear not – as long as the markets are still Open…even with sideways, compression movement – powerful coiling is occurring inside. We’ll soon break toward a resolution, in my view.
How soon?  Anybody’s guess.  It is still vacation season for many big portfolio managers, head traders and house gurus.
And for the first time in a while, there’s good reason to closely watch for a major move in several heavily traded products…Equities, Bonds, Energy – AND – Metals.
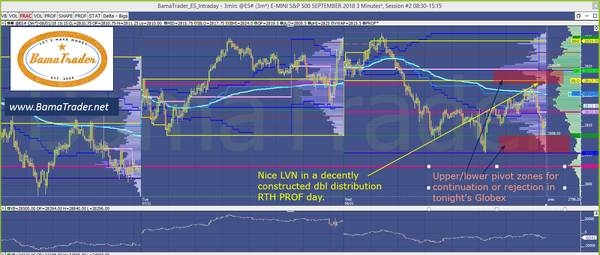
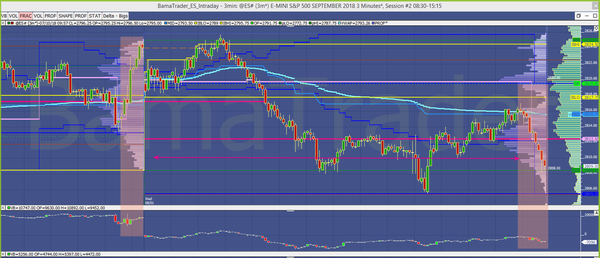
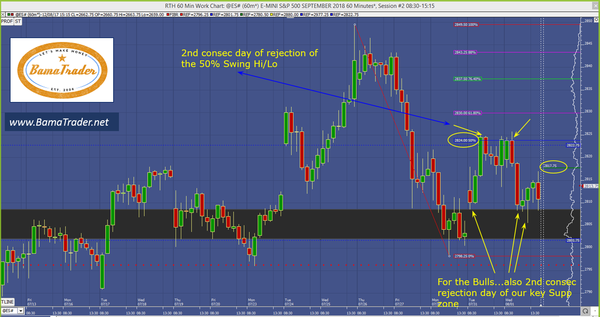
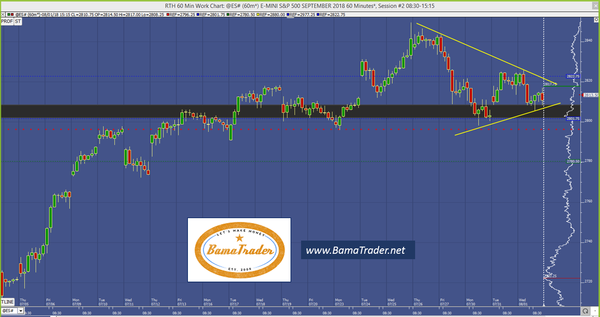
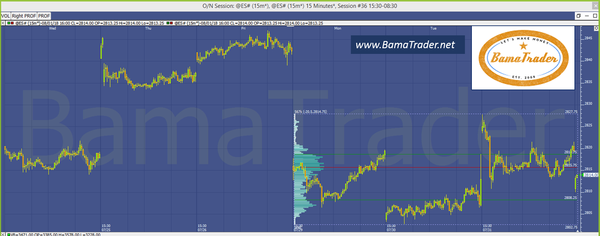
( I lead with a chart below showing the key Resistance and Support pivot zones for the ESU8 (Sept S&P Futures). Breach of either zone could be the portal for the next strong directional move. )
I believe it’s prudent, though, for primary expectations to anticipate internals remaining (summer) choppy, restraining equity futures from any strong directional move.
THAT is UNLESS – a material catalyst (numbered below) surfaces to take firm hold.
Not if, but when that happens – satisfactory Balance of Power could be suddenly with either Buyers or Sellers.  Whichever side possesses the next power position likely generates a relentless directional move. (Hey, end of summer vacations is close, right?)
Especially given 1/ the actual (ES) trading location we occupy now 2/ the amount of coiled energy available.
We’ve been discussing many possibilities on our private channels while we play the waiting game.  I’m confident our Team is ready.
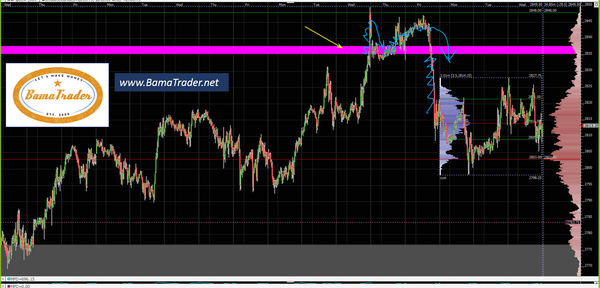
Last week’s rejection of the Jan/Feb reaction High levels continue to weigh on the S&P’s.
Bonds, even at important intermediate Support, seem to be able to find a Bid when they need it…so far.
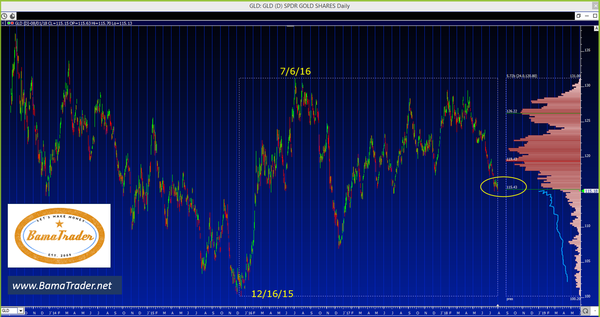
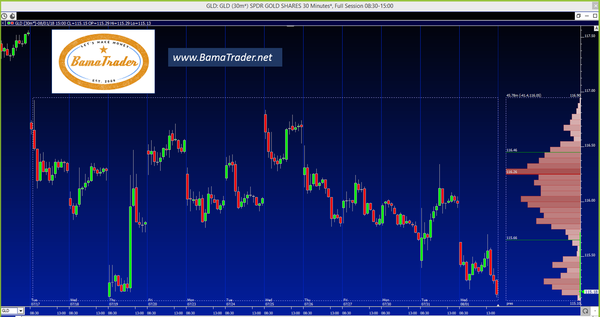
Physical Gold and GLD are trading at “5-Star”, Trap-door-type Support levels.
Crude Oil is still smarting from the sudden turn around in the Bullish fortunes a few weeks ago.  However, chatter about increased Persian Gulf becoming active has gone from 0 to 100 just in the past 48 hours.
Back to the S&P’s…..
All sideways market’s are not created equal.
There is an eerie calm right now in equity futures.  Oh sure, the FANGS, TWITTER and TESLA have rattled many Tech Stocks out of their complacency slumber – but broader equity indexes are retreating from a six-month Resistance level, and looking for a way to resolve it.
YOU know where we think the next chapter takes us – but, we’ll let Order Flows take us from level to level.
In my view, the top four ‘uncertainties’ holding keys to the next directional market moves are:
  1. What is China’s next move?  The U.S. Administration appears unwilling to back down the rhetoric or pressure no matter what response is delivered from a Trading partner – BUT, nonetheless, is turning UP the heat with additional, sometimes unexpected tariffs.
  2. The U.S. Administration’s response to Iran’s naval exercises in the Persian Gulf which look likely to occur sometime in the next 72 hours.
  3. A global, contagion-type event – triggered by a large, unexpected move beginning with Emerging Market currencies, moving quickly through the global financial transmission system.
  4. U.S. equities breaching key levels (Up or Down), advancing into a directional, high velocity, high volume move.
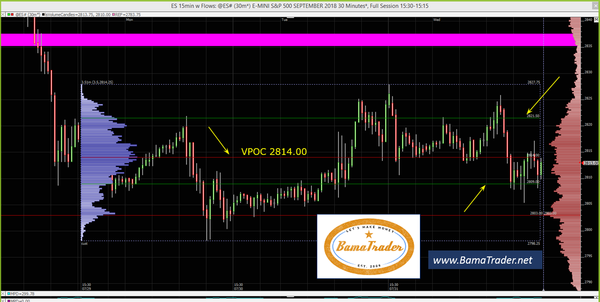
As I write this, U.S. equity futures are weakening near the lower support zone (see the chart below).
With meetings out of the way from the BOJ and FED, we get the BOE decision on Thursday morning at 7amET.  This leaves markets able to shift into a more 2-way, deliberative mode.  Key levels can be tested via auction instead of just reacting to a well-crafted “statement”.
Personally, I would not be surprised to see the S&P Futures attempt a complete round-trip to re-auction the “Independence Day” price levels very soon.
Let’s see if I’m right.
Tonight’s LiveScreen/Systems webcast code is below….then you can review again the charts posted earlier tonight on the Team-Member SLACK channel.
We’ll see you ‘Live’ Thursday morning for our pre-market brief with updated levels we’re watching.
BT
​​​​​​​​​​​​​​​​​​​​​LiveScreen/Systems webcast code for tonight’s Globex Session:
www.ZOOM.us
CODE:  
782-174-xxxx  ( Sorry, code only for full members )
CLICK HERE for a SPECIAL SUMMER OFFER to 
become a Full Subscriber to BamaTrader
WE ENCOURAGE YOU TO FORWARD THIS TO A FELLOW TRADER, INVESTOR OR INSTITUTIONAL DESK
Chart 1:  Our main 3min Chart with inventory Profiles and the two key zones to watch for tonight’s Globex and early RTH
Chart 2:  Quite a contrast between the last two RTH Closes
Chart 3: It’s helpful to me to revisit this chart – as we saw it BEFORE the recent thrust above the ‘pink’ line (we had already established the ‘pink’ line as important RES zone).  Then, we get the ‘Batman’ market structure as it goes vertical above it, then vertical below it, finally coming to rest in the prior inventory levels where the S&P500 is presently “mired in mud”.
Chart 4: Remember this is a 24hr PROF chart – but useful nonetheless, imo.  The multi-day PROF there in ‘blue’ has developed decent VPOC perch at 2814.00.   This chart also highlights just how thin it could get above 2822 and below 2807-09
Chart 5: ES emini Futures with key measured move locations and other annotations.
Chart 6: Energy release from the wedge just ahead?
Chart 7: 3-day Globex-ONLY PROF.  Some have left this “tool” behind, but personally, I still find the Overnight-Only Profile useful.
Chart 8: GLD – Big picture (daily w/PROF) – sitting at the trap doo?  If so, for those wanting to buy Gold for the long term, BIG buying opportunities could be just ahead.
Chart 9: GLD – 5min chart, with multi-day MCPROF.  Solid, aggressive selling in GLD, 5 out of the last 6 sessions – steadily away from the Swing VPOC.
Chart 10: Our proprietary S&P Tick calculation…. Hats off to “Mr. Market”….masterful job keeping equity indexes somewhat tame, all the while – steady distribution continues.
Older posts

© 2024

Theme by Anders NorenUp ↑