Thursday
08/02/18
12:35pmCT
Unless you trade U.S. equity Futures, it’s hard to describe just how mixed and choppy internal Order Flows have been for the last 3 to 5 sessions.
Not quite believing the extent of Order Flow ‘chop’ myself – I took a deep(er) dive into internals during our post-market work after the close.
Seems like equity futures, and maybe the market itself, can’t quite break free from the “holiday trading spell” cast during the week of July 4th.
Fear not – as long as the markets are still Open…even with sideways, compression movement – powerful coiling is occurring inside. We’ll soon break toward a resolution, in my view.
How soon? Anybody’s guess. It is still vacation season for many big portfolio managers, head traders and house gurus.
And for the first time in a while, there’s good reason to closely watch for a major move in several heavily traded products…Equities, Bonds, Energy – AND – Metals.
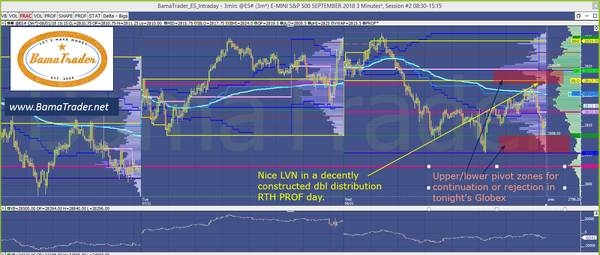
( I lead with a chart below showing the key Resistance and Support pivot zones for the ESU8 (Sept S&P Futures). Breach of either zone could be the portal for the next strong directional move. )
I believe it’s prudent, though, for primary expectations to anticipate internals remaining (summer) choppy, restraining equity futures from any strong directional move.
THAT is UNLESS – a material catalyst (numbered below) surfaces to take firm hold.
Not if, but when that happens – satisfactory Balance of Power could be suddenly with either Buyers or Sellers. Whichever side possesses the next power position likely generates a relentless directional move. (Hey, end of summer vacations is close, right?)
Especially given 1/ the actual (ES) trading location we occupy now 2/ the amount of coiled energy available.
We’ve been discussing many possibilities on our private channels while we play the waiting game. I’m confident our Team is ready.
Last week’s rejection of the Jan/Feb reaction High levels continue to weigh on the S&P’s.
Bonds, even at important intermediate Support, seem to be able to find a Bid when they need it…so far.
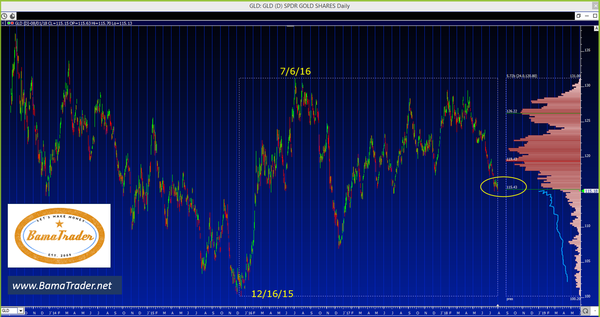
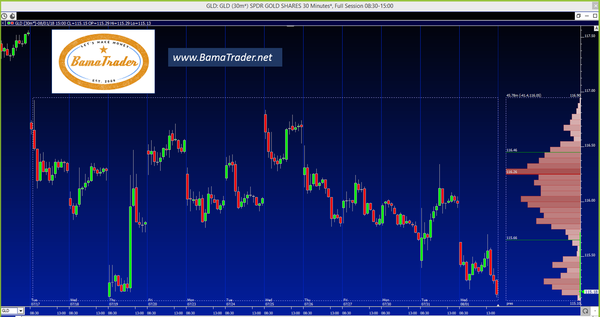
Physical Gold and GLD are trading at “5-Star”, Trap-door-type Support levels.
Crude Oil is still smarting from the sudden turn around in the Bullish fortunes a few weeks ago. However, chatter about increased Persian Gulf becoming active has gone from 0 to 100 just in the past 48 hours.
Back to the S&P’s…..
All sideways market’s are not created equal.
There is an eerie calm right now in equity futures. Oh sure, the FANGS, TWITTER and TESLA have rattled many Tech Stocks out of their complacency slumber – but broader equity indexes are retreating from a six-month Resistance level, and looking for a way to resolve it.
YOU know where we think the next chapter takes us – but, we’ll let Order Flows take us from level to level.
In my view, the top four ‘uncertainties’ holding keys to the next directional market moves are:
- What is China’s next move? The U.S. Administration appears unwilling to back down the rhetoric or pressure no matter what response is delivered from a Trading partner – BUT, nonetheless, is turning UP the heat with additional, sometimes unexpected tariffs.
- The U.S. Administration’s response to Iran’s naval exercises in the Persian Gulf which look likely to occur sometime in the next 72 hours.
- A global, contagion-type event – triggered by a large, unexpected move beginning with Emerging Market currencies, moving quickly through the global financial transmission system.
- U.S. equities breaching key levels (Up or Down), advancing into a directional, high velocity, high volume move.
As I write this, U.S. equity futures are weakening near the lower support zone (see the chart below).
With meetings out of the way from the BOJ and FED, we get the BOE decision on Thursday morning at 7amET. This leaves markets able to shift into a more 2-way, deliberative mode. Key levels can be tested via auction instead of just reacting to a well-crafted “statement”.
Personally, I would not be surprised to see the S&P Futures attempt a complete round-trip to re-auction the “Independence Day” price levels very soon.
Let’s see if I’m right.
Tonight’s LiveScreen/Systems webcast code is below….then you can review again the charts posted earlier tonight on the Team-Member SLACK channel.
We’ll see you ‘Live’ Thursday morning for our pre-market brief with updated levels we’re watching.
BT
LiveScreen/Systems webcast code for tonight’s Globex Session:
www.ZOOM.us
CODE: 782-174-xxxx ( Sorry, code only for full members )
CODE: 782-174-xxxx ( Sorry, code only for full members )
CLICK HERE for a SPECIAL SUMMER OFFER to
become a Full Subscriber to BamaTrader
WE ENCOURAGE YOU TO FORWARD THIS TO A FELLOW TRADER, INVESTOR OR INSTITUTIONAL DESK
Chart 1: Our main 3min Chart with inventory Profiles and the two key zones to watch for tonight’s Globex and early RTH
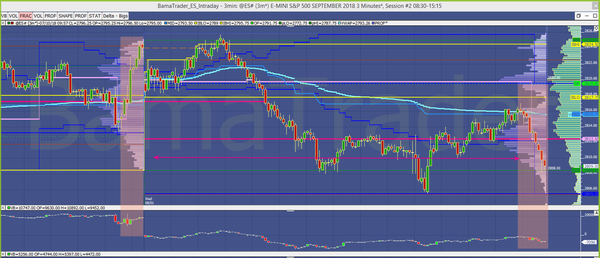
Chart 2: Quite a contrast between the last two RTH Closes
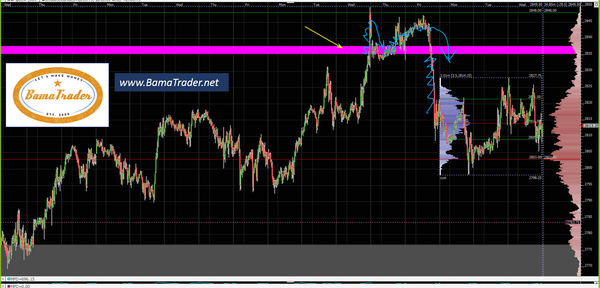
Chart 3: It’s helpful to me to revisit this chart – as we saw it BEFORE the recent thrust above the ‘pink’ line (we had already established the ‘pink’ line as important RES zone). Then, we get the ‘Batman’ market structure as it goes vertical above it, then vertical below it, finally coming to rest in the prior inventory levels where the S&P500 is presently “mired in mud”.
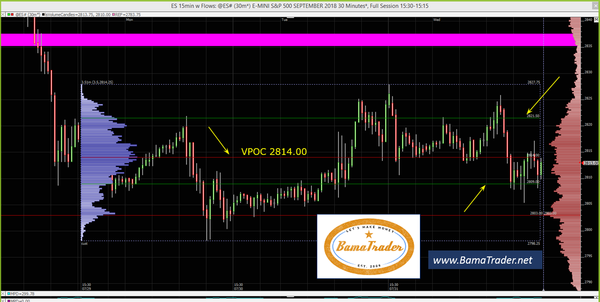
Chart 4: Remember this is a 24hr PROF chart – but useful nonetheless, imo. The multi-day PROF there in ‘blue’ has developed decent VPOC perch at 2814.00. This chart also highlights just how thin it could get above 2822 and below 2807-09
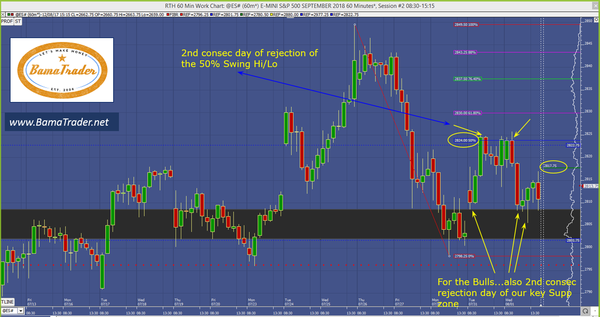
Chart 5: ES emini Futures with key measured move locations and other annotations.
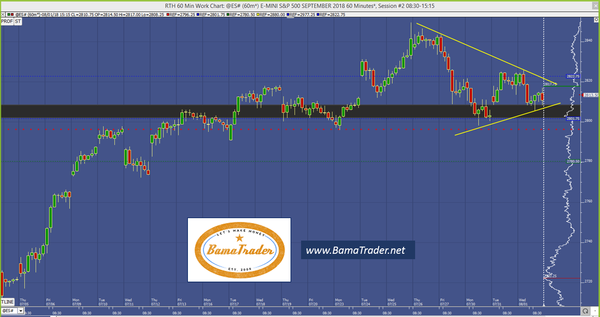
Chart 6: Energy release from the wedge just ahead?
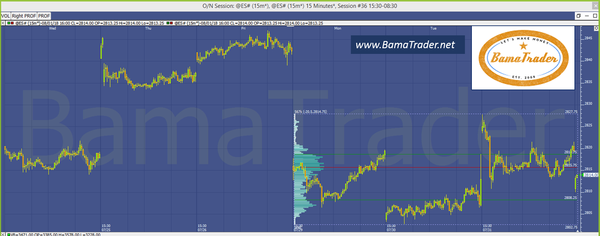
Chart 7: 3-day Globex-ONLY PROF. Some have left this “tool” behind, but personally, I still find the Overnight-Only Profile useful.
Chart 8: GLD – Big picture (daily w/PROF) – sitting at the trap doo? If so, for those wanting to buy Gold for the long term, BIG buying opportunities could be just ahead.
Chart 9: GLD – 5min chart, with multi-day MCPROF. Solid, aggressive selling in GLD, 5 out of the last 6 sessions – steadily away from the Swing VPOC.
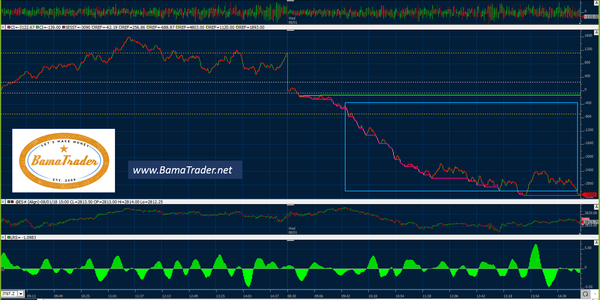
Chart 10: Our proprietary S&P Tick calculation…. Hats off to “Mr. Market”….masterful job keeping equity indexes somewhat tame, all the while – steady distribution continues.

